
Why Sticker Price Misleads You
Most people scan a grocery shelf and make decisions based on total price. A $2.00 item feels affordable; a $6.00 item feels expensive. But that comparison tells you almost nothing useful without knowing how many meals each one produces.
A $6.00 bag of dried black beans, for instance, might yield 20 servings - coming in at $0.30 per serving. A $2.00 bag of flavored instant noodles might yield two servings at $1.00 each. The "cheap" item costs more than three times as much per meal.
This is the core problem with sticker-price thinking: it anchors your judgment to the wrong number. Cost per serving cuts through that distortion. It's part of the broader framework described in cost-per-use thinking - dividing what you pay by what you actually get.
$0.10
Typical cost per serving of rolled oats
Based on standard US retail pricing for a 42-serving canister of plain rolled oats, one of the most affordable breakfast options available.
~30%
Average share of US household income spent on food
USDA data consistently shows food accounts for a significant share of spending for lower-income households, making per-serving value analysis especially impactful.
$1,500+
Estimated annual food waste cost per US household
USDA estimates suggest the average American household discards a substantial portion of purchased food, which directly raises effective cost per serving.
How to Calculate It in 10 Seconds
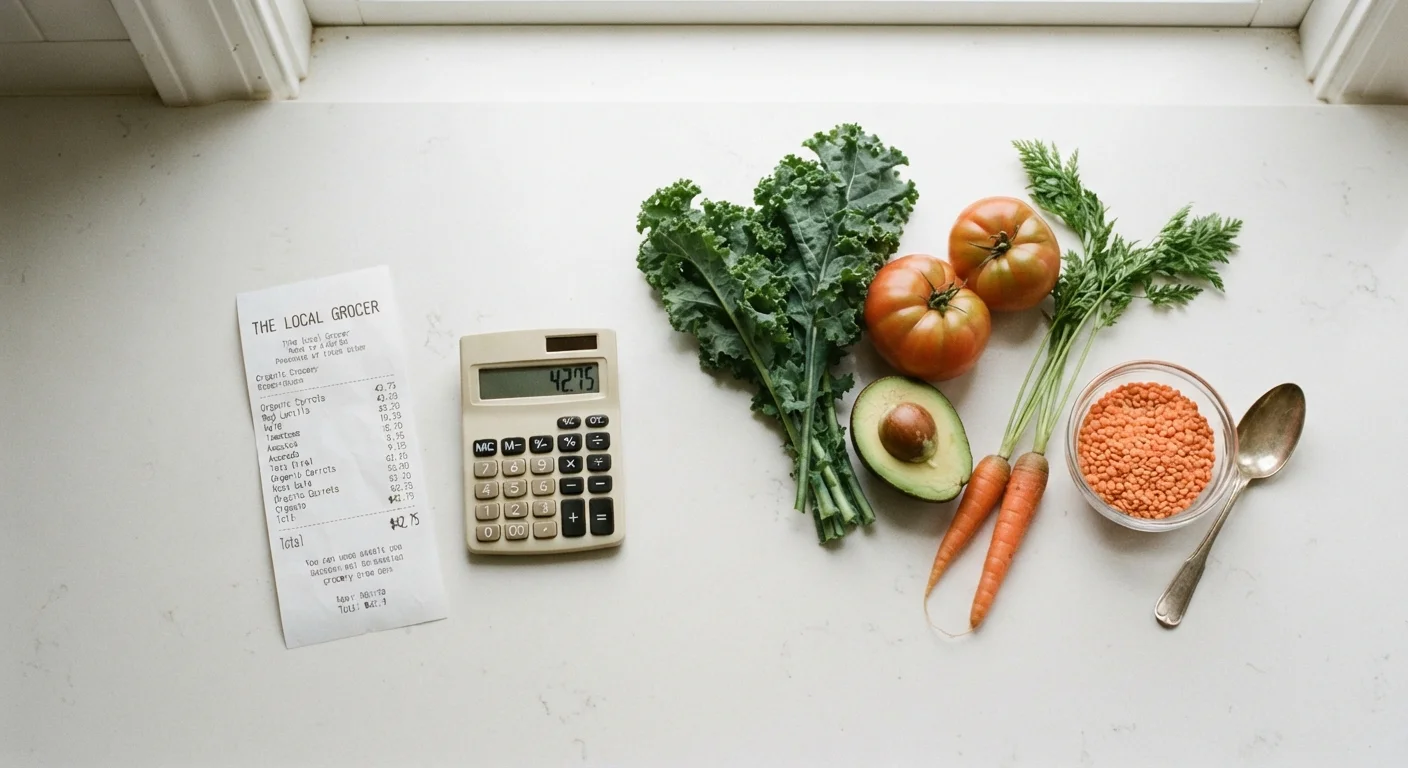
The formula is straightforward: Total Price ÷ Number of Servings = Cost Per Serving.
The number of servings is printed on every Nutrition Facts label in the US. You can use that figure directly, or substitute your own realistic portion if the label's serving size doesn't match how you eat.
A few quick examples:
- A $1.29 can of chickpeas with about 3.5 servings = roughly $0.37 per serving
- A $4.50 rotisserie chicken yielding 6 servings = $0.75 per serving
- A $0.89 bunch of bananas (about 6 bananas) = approximately $0.15 per serving
Once you've done this a few times, it becomes second nature. You stop seeing price tags and start seeing meal costs. For a broader structure around weekly grocery decisions, the weekly grocery budget framework pairs well with this approach.
Keep a Short Reference List
Write down the cost per serving for your 10-15 most frequently purchased items and keep it in your phone or on your fridge. Over time, this list becomes a personal price anchor that helps you spot genuine deals - and see through ones that only look affordable.
Where Cost Per Serving Gets More Nuanced
Cost per serving is a powerful filter, but it has limits. Two foods can have identical cost per serving while delivering very different nutritional value - and for budget-conscious eaters trying to stay healthy, that gap matters.
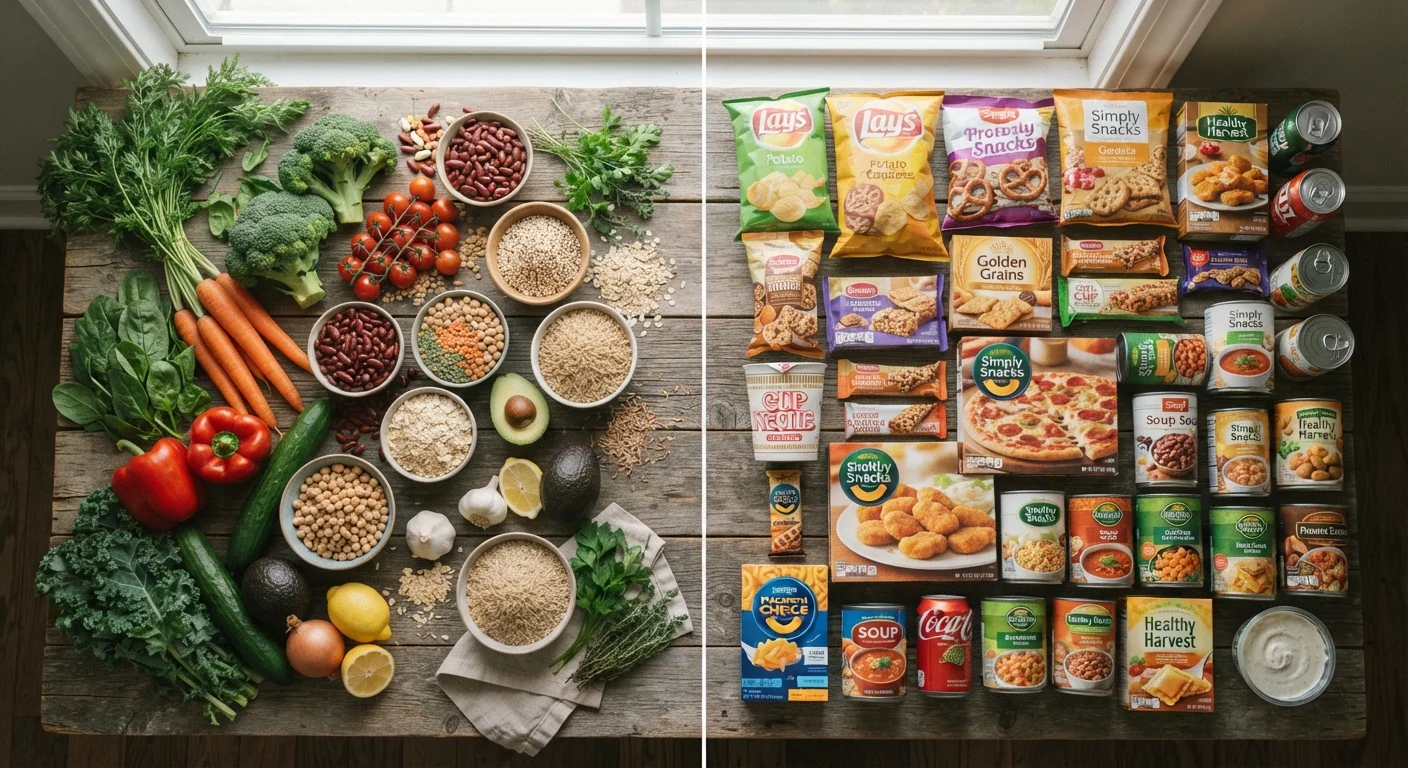
The most useful move is to layer in a rough sense of nutritional density: does this serving provide protein, fiber, or key micronutrients, or mostly refined carbohydrates and sodium? Research consistently shows that minimally processed whole foods tend to score well on both metrics. The price-per-nutrient comparison between whole and processed foods reveals that the gap is often smaller than people assume.
Waste is another variable. An inexpensive head of cabbage has a very low cost per serving - but only if you use the whole head before it wilts. For perishables, factor in realistic usage to avoid inflating your actual cost.
This article provides general nutrition and budgeting information for educational purposes. It is not medical or financial advice. Consult a qualified professional for guidance specific to your health or financial situation.