
The Two Broad Categories of Every Energy Bill
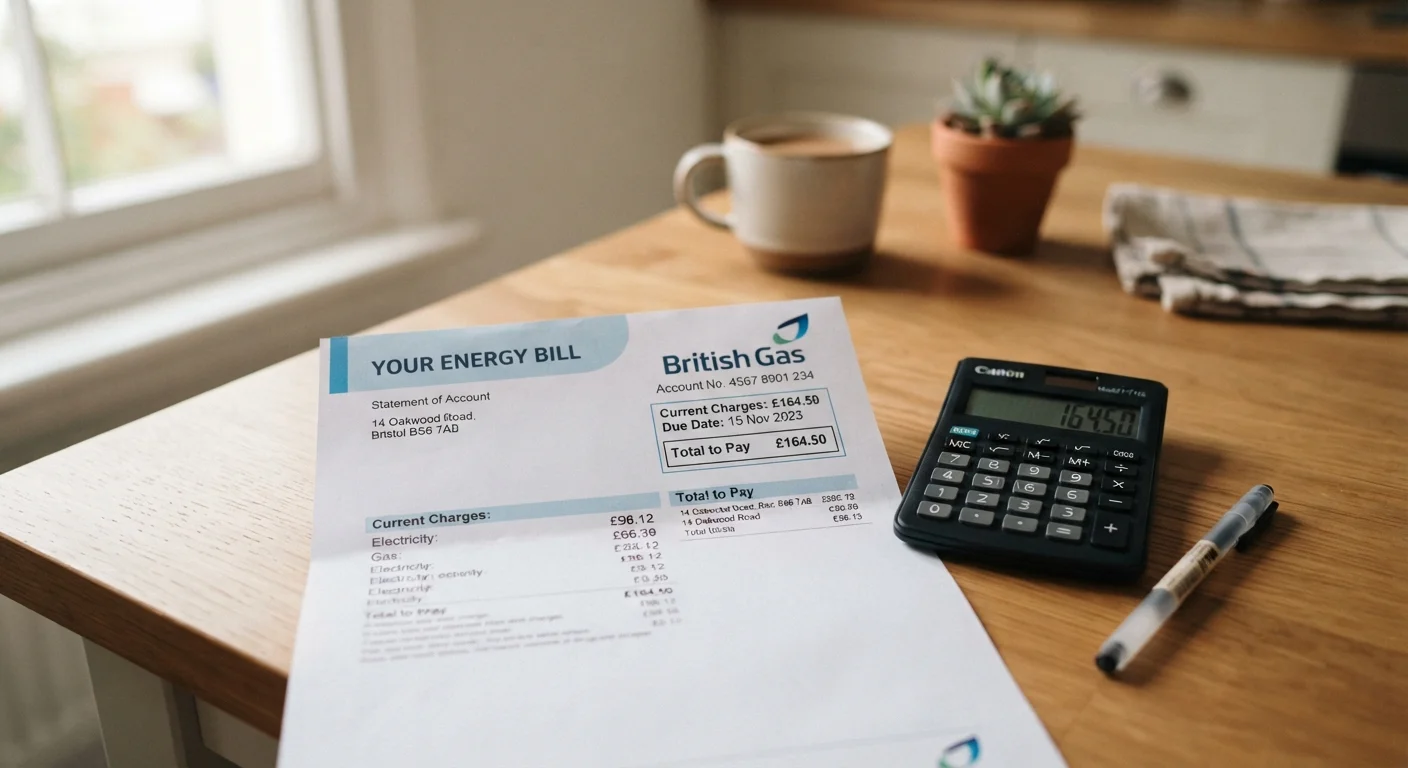
Every home energy bill - whether for electricity, gas, or a combined statement - splits into two fundamental buckets: supply charges and delivery charges.
Supply charges cover the actual energy your home consumed. This is the portion directly linked to your habits - running the dishwasher, heating your water, keeping the lights on. It is calculated by multiplying your usage (in kWh for electricity or therms for gas) by your rate per unit.
Delivery charges are what you pay your utility to physically move that energy from the power plant or pipeline to your home. These cover infrastructure maintenance, meter reading, and grid reliability. The critical thing to know: delivery charges are mostly fixed. Even in a month where you cut your usage in half, delivery charges may barely budge.
If you have ever slashed your energy use and felt disappointed by a bill that barely dropped, fixed delivery fees are usually the reason. Understanding this split helps set realistic expectations for how much your habits can actually move the needle. For a deeper look at the terminology you will encounter, see our plain-language energy terms reference.
Line Items You Will Actually See - and What They Mean
Beyond supply and delivery, most bills include several additional charges. Here is what they typically represent:
- Energy/Commodity Charge: The core usage cost - your consumption in kWh or therms multiplied by the applicable rate.
- Tiered or Time-of-Use Adjustments: If your utility uses tiered pricing, usage above a set threshold is billed at a higher rate. Time-of-use plans charge more during peak demand hours (typically late afternoon to early evening on weekdays).
- Demand Charge: More common in commercial billing but appearing in some residential plans, this charges based on your highest single period of power draw during the month - not just total consumption.
- Fuel Adjustment Charge: A pass-through cost reflecting changes in the price your utility paid for fuel. It fluctuates and is outside your control.
- Taxes and Regulatory Fees: State and local taxes, franchise fees, and charges mandated by regulators. These are non-negotiable and typically a small percentage of your total.
- Renewable Energy or Low-Income Assistance Programs: Many utilities include small surcharges that fund state-mandated programs. These are usually just a few dollars per month.
~50%
Of home energy used for heating and cooling
According to the U.S. Energy Information Administration, space heating and cooling typically account for about half of a household's total energy consumption.
$1,500+
Average annual U.S. household electricity spend
The U.S. Energy Information Administration estimates average U.S. household electricity expenditures exceed $1,500 per year, varying significantly by region and home size.
~14%
Of electricity use from water heating
The U.S. Department of Energy estimates water heating accounts for roughly 14-18% of a typical home's energy use, making it the second or third largest energy expense.
Knowing which charges are variable - and therefore responsive to your behavior - is the foundation for making meaningful changes. Generally, your energy/commodity charge and any tiered adjustments are where your habits have the most direct impact.
How to Read Your Usage History (and Why It Matters More Than the Dollar Amount)
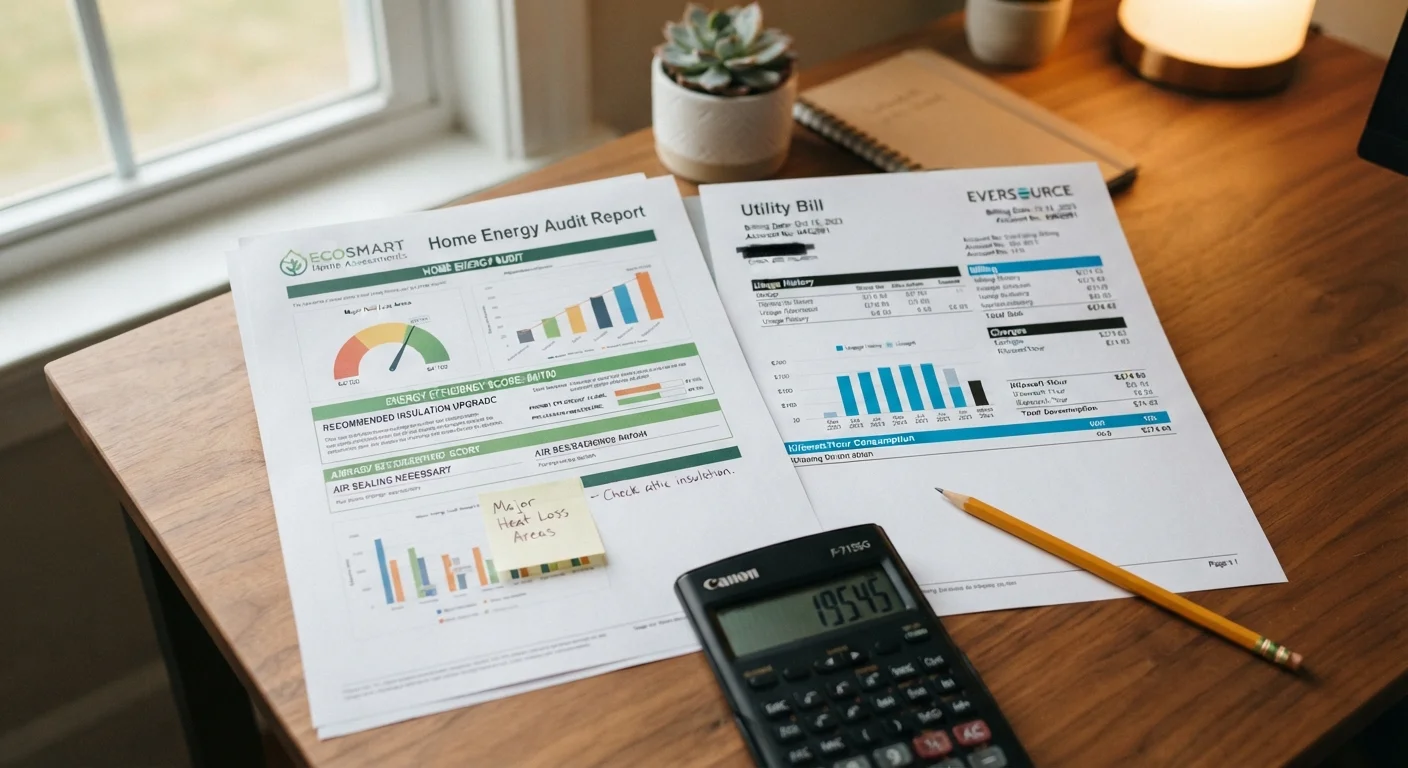
The dollar total on your bill is influenced by rates, fees, and taxes that shift constantly. Your usage in kWh or therms is the cleaner signal. Most bills and online utility portals include a 12- or 13-month usage chart - this is one of the most useful tools available to you.
Look for patterns: Does usage spike in January and July? That points to heating and cooling loads. Does it creep up gradually over several months without an obvious seasonal reason? That can signal an aging appliance drawing more power, a developing insulation problem, or new plug-in devices accumulating over time.
Use Your Usage History, Not Just the Total
Log into your utility's online portal and pull up your 12-month usage chart. Set a simple goal: match or beat your usage from the same month last year. This approach removes seasonal and rate-change noise, giving you a much cleaner picture of whether your conservation efforts are actually working.
Comparing the same month year-over-year (January this year vs. January last year) is far more informative than comparing consecutive months, since seasonal swings dwarf most behavioral changes. If your kWh is lower but your bill is higher, a rate increase is the likely culprit - not something you did wrong.
For a practical approach to reducing what you actually can control, our home energy savings primer walks through quick wins and longer-term strategies. And if certain habits are costing more than you realize, the laundry energy habits guide is a solid starting point - laundry is often one of the largest controllable loads in a home.
Which Charges Can You Actually Influence?
Not all line items respond to your behavior. Here is a practical breakdown:
- High influence:
- Energy/commodity charge - directly tied to consumption. Heating, cooling, water heating, and large appliances account for the majority of most household energy budgets. Reducing or shifting their use produces real savings.
- Moderate influence:
- Tiered-rate and time-of-use charges - shifting high-draw tasks (laundry, dishwashing, EV charging) to off-peak hours, or staying within the lower consumption tier, can lower your effective rate.
- Low or no influence:
- Delivery fees, fuel adjustments, taxes, and program surcharges. These are set by your utility and regulators. In deregulated states, switching suppliers may affect supply rates, but delivery fees remain with your local utility regardless.
Common beliefs about which changes matter most are not always accurate - our article on home energy myths covers several that may be silently costing households money. For adjustments that track the calendar, a year-round seasonal energy strategy can help you stay proactive rather than reactive all year.